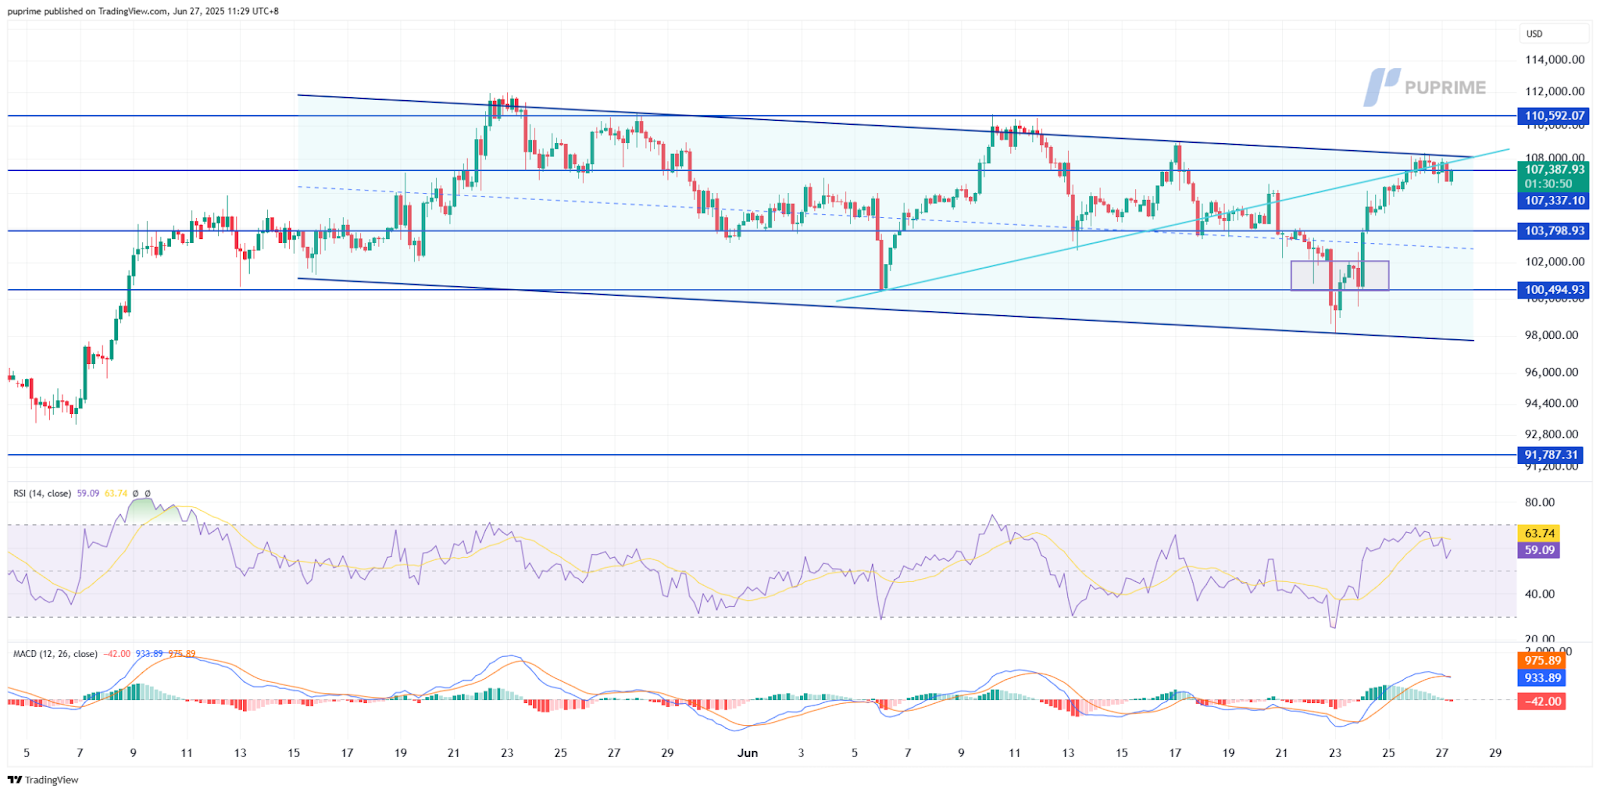
Bitcoin (BTC/USD) is attempting to break out of a descending channel that has governed price action since early June, with the current rally pushing up against the upper boundary of this pattern. The move has gained traction after reclaiming the $107,000 area, a key horizontal level that previously acted as both support and resistance. However, BTC now faces a decisive test near the $107,340–$108,100 region, where a confluence of trendline resistance and horizontal supply could stall the advance or confirm a bullish breakout.
Technicals are showing mixed signals. The RSI has climbed to 59, reflecting improving bullish momentum while still maintaining room for further upside before hitting overbought territory. Meanwhile, the MACD has just completed a bearish crossover, with the signal line moving above the MACD line — a typical early signal of weakening momentum. Concurrently, the MACD histogram is turning increasingly red, reinforcing the view that the recent bullish drive is fading.
A confirmed breakout above the channel ceiling and sustained trading above $108,100 would signal a structural shift toward bullish momentum, potentially targeting the $110,600 resistance zone. Conversely, failure to clear this hurdle could invite renewed selling pressure, with initial support seen near $103,800 and a deeper fallback to $100,500 if downside accelerates. Until price escapes the broader range decisively, BTC remains at a technical crossroads, with its medium-term trend hinging on whether this current push is a breakout or merely another rejection.
Resistance Levels: 108,100.00, 110,600.00
Support Levels: 103,800.00, 100,500.00
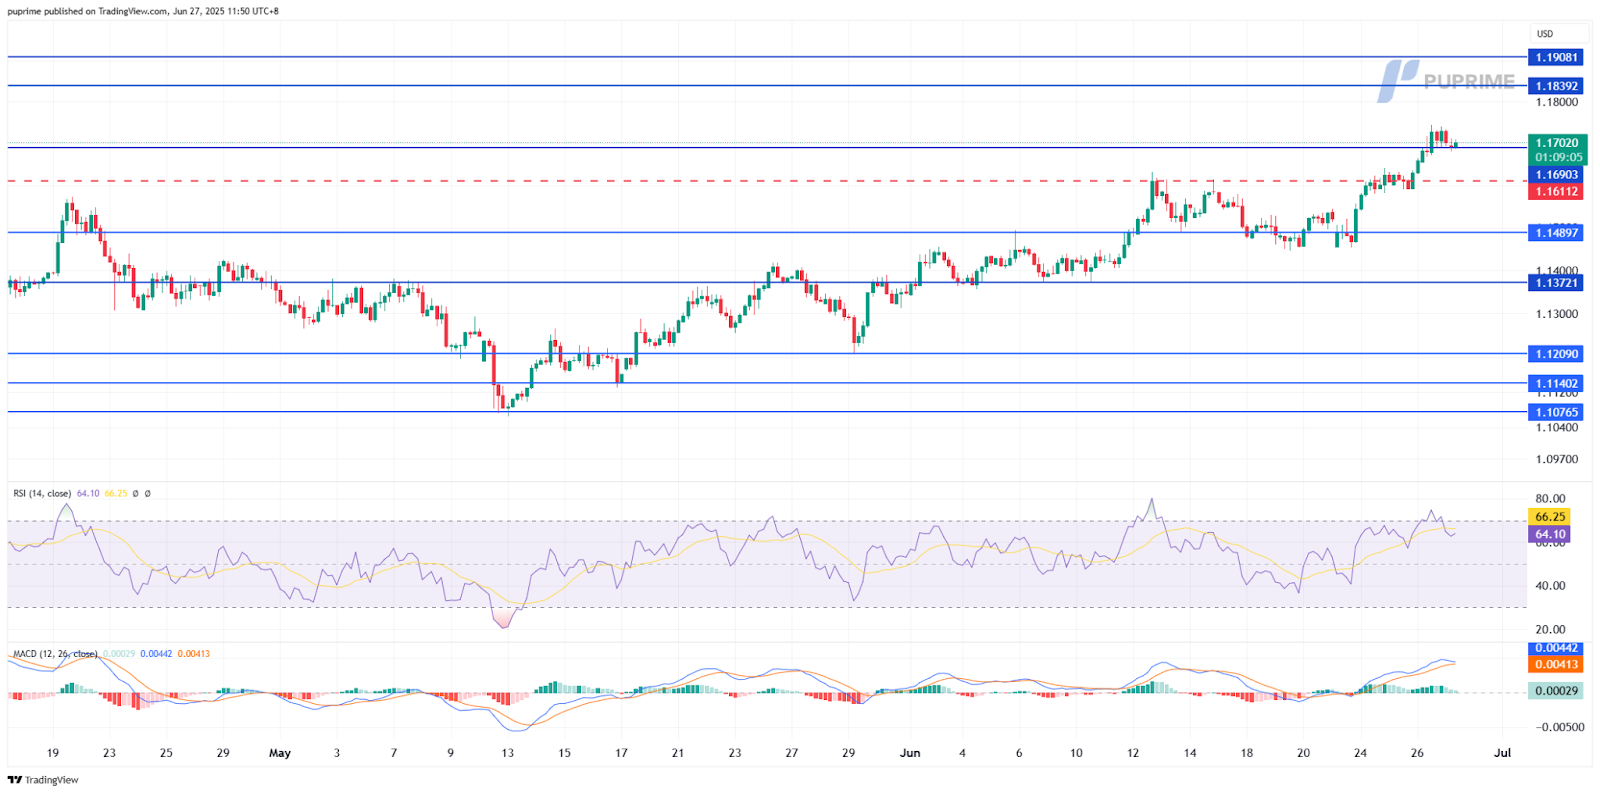
EURUSD, H4
EUR/USD has posted an impressive rally in recent sessions, breaking cleanly above the 1.1610–1.1690 resistance zone and reaching its highest levels in nearly two months. This surge signals a meaningful bullish shift in market structure, with the pair decisively exiting its prior consolidation phase. The breakout not only confirms underlying euro strength but also suggests renewed confidence in the single currency amid shifting macro sentiment.
Yet, beneath this surface-level strength, momentum indicators are beginning to raise caution. The Relative Strength Index (RSI) currently hovers near 64—just below traditional overbought levels—but appears to be flattening, suggesting waning buying pressure. Meanwhile, the MACD histogram has lost traction, and the MACD line is on the verge of crossing below the signal line—a bearish crossover that, if confirmed, would mark a potential momentum reversal. This growing divergence between price action and technical indicators introduces a layer of uncertainty into the bullish narrative.
The key tension now lies between the strong price breakout and weakening underlying momentum. Historically, such divergence tends to resolve in one of two ways: a modest consolidation that allows indicators to cool, or a deeper correction that realigns price with deteriorating momentum. If EUR/USD fails to hold above 1.1840, a pullback toward the 1.1690–1.1610 support band cannot be ruled out. However, sustained strength above this level would keep the broader bullish trend intact, with eyes set on the 1.1840 and 1.1900 resistance levels ahead.
Resistance Levels: 1.1840, 1.1900
Support Levels: 1.1690, 1.1610
Mulai Trading dengan Keunggulan
Trading forex, indeks, Logam, dan lainnya dengan spread rendah di bidang ini dan eksekusi secepat kilat.
Mulai trading dengan deposit hingga serendah $50 di akun standar kami.
Nikmat akses ke layanan dukungan 24/7.
Akses ratusan instrumen, sarana edukasi gratis, dan berbagai promosi terbaik yang pernah ada.
Please note the Website is intended for individuals residing in jurisdictions where accessing the Website is permitted by law.
Please note that PU Prime and its affiliated entities are neither established nor operating in your home jurisdiction.
By clicking the "Acknowledge" button, you confirm that you are entering this website solely based on your initiative and not as a result of any specific marketing outreach. You wish to obtain information from this website which is provided on reverse solicitation in accordance with the laws of your home jurisdiction.
Ten en cuenta que el sitio web está destinado a personas que residen en jurisdicciones donde el acceso al sitio web está permitido por la ley.
Ten en cuenta que PU Prime y sus entidades afiliadas no están establecidas ni operan en tu jurisdicción de origen.
Al hacer clic en el botón "Aceptar", confirmas que estás ingresando a este sitio web por tu propia iniciativa y no como resultado de ningún esfuerzo de marketing específico. Deseas obtener información de este sitio web que se proporciona mediante solicitud inversa de acuerdo con las leyes de tu jurisdicción de origen.